Lab Sheet 01
1.Draw a flow chart to input 2 numbers and find the total
2. Draw a flow chart to input 3 numbers and find the average
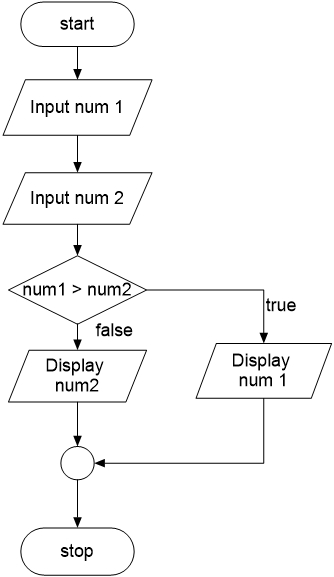
3. Draw a flow chart to input 2 numbers and find the larger one.
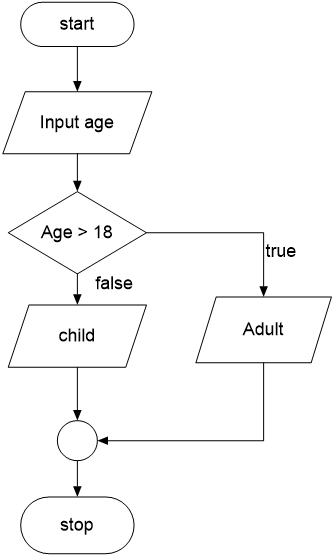
4. Draw a flow chart input an age of a person and find whether the person is an adult or a child. (Age>18 considered as an adult)
5. Draw a flow chart to convert temperature from Fahrenheit degrees to Celsius degrees.
Use the equation C = 5/9*(F-32), Where C is Celsius and F is Fahrenheit.
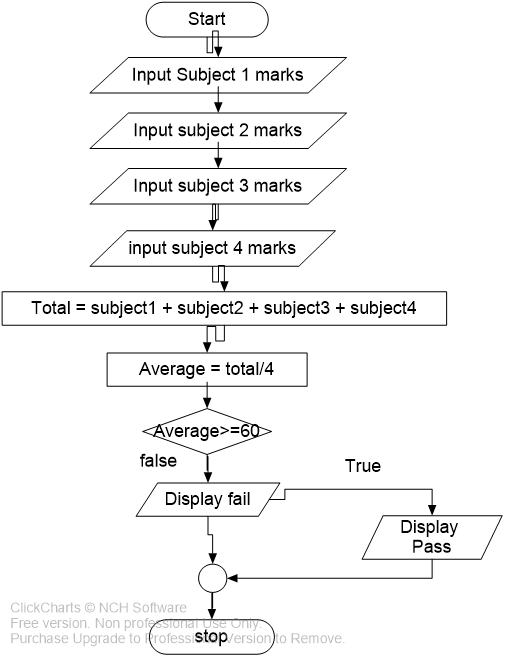
6. Draw Flow chat to input marks of 4 subjects and display Pass or fail
If Average>= 60 , “Pass” otherwise “Fail”)
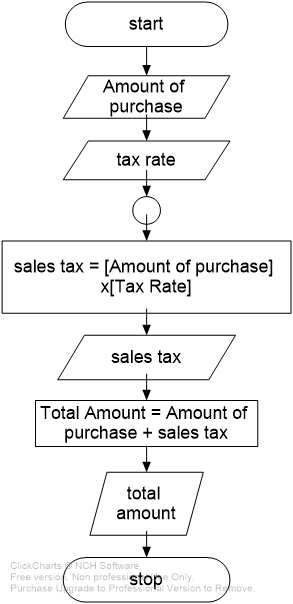
7. Write a program to input amount that a customer purchases a certain good, and the tax rate (in percentage) of the good, and calculate the total amount that the customer should pay for this good, and print the sales tax rate and the total amount customer paid.
Hint: sales tax = amount of purchased x tax rate.
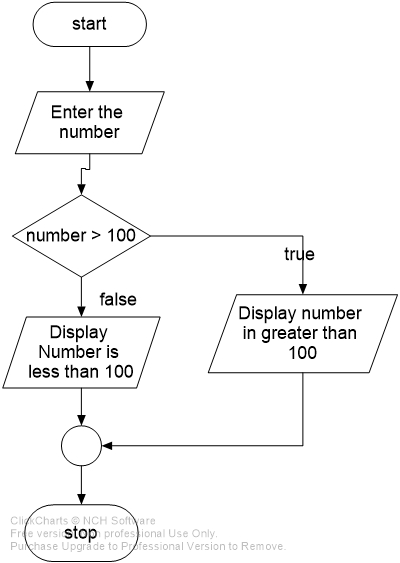
8. Draw a flow chart to get the Number as a key board input and check whether this number is greater than 100. if number is greater than 100 print “Number is greater than 100” otherwise print “Number is less than 100”.
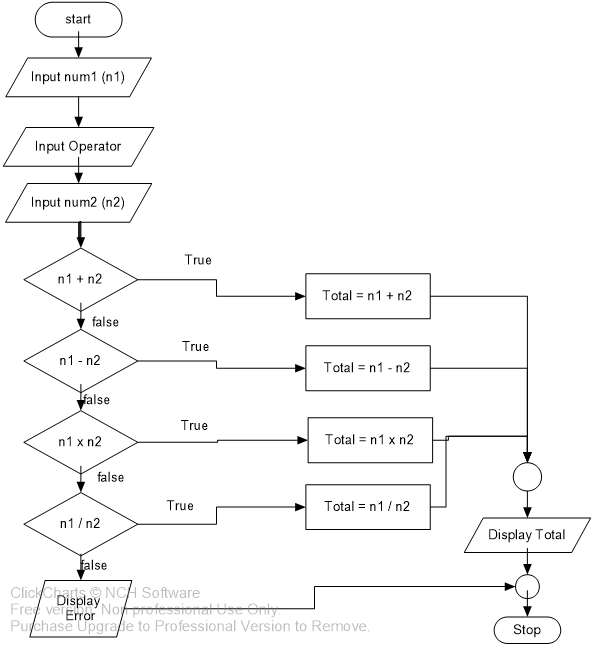
9. Draw a flow chart to create a simple calculator. The program should allow the user to enter two numbers and an option. The options are
1. +
2. –
3. *
4. /
You should print an appropriate error message if the user enters invalid data.
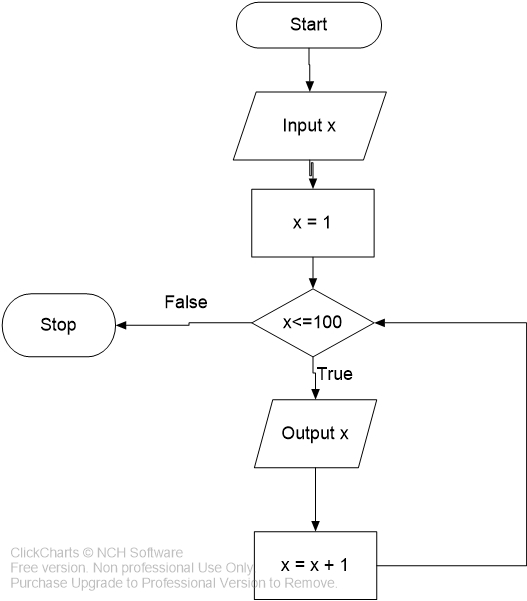
10. Draw a flow chart to print numbers from 1 to 100.
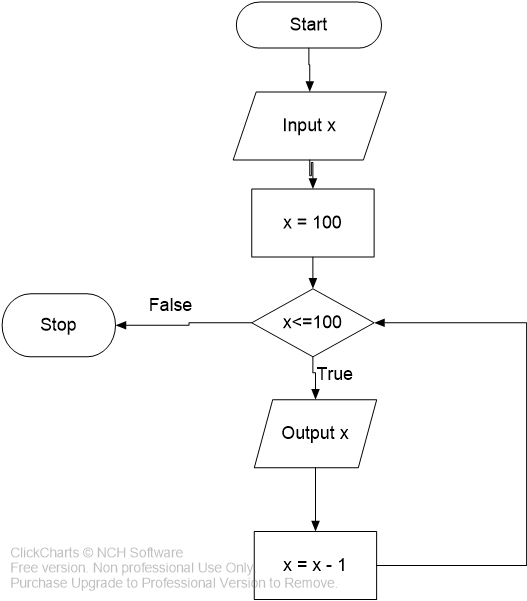
11. Draw a flow chart to print numbers from 100 to 1
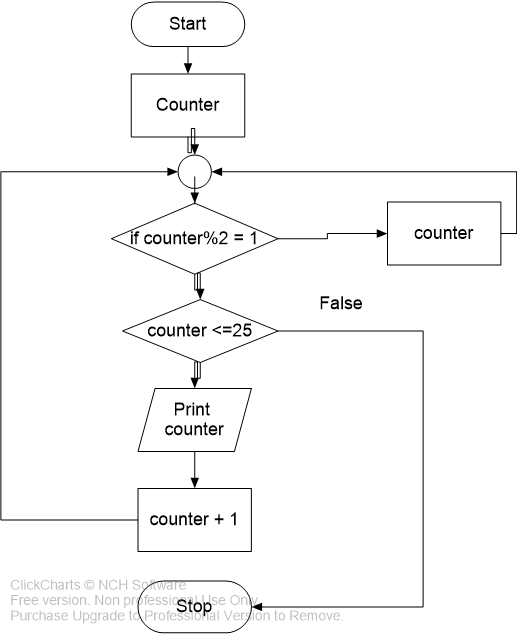
12. Draw a flow chart to print odd numbers between 1 and 25
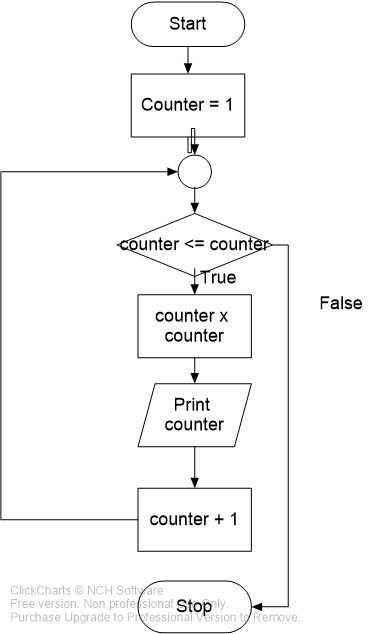
13. Draw a flow chart to generate following number series
1,4,9,16,25………
Please comment.Thanks


